2.6.17. directlabels in R
1. Introduction
The directlabels package provides tools for adding direct, non-overlapping labels to plots in R. Unlike legends, direct labels are placed right next to the data they describe, making plots easier to interpret. The package is especially useful for labeling lines in line plots and for simple scatterplots.
# Create a dummy ADAM dataset (ADLB - Laboratory Results Analysis Dataset)
set.seed(123)
adsl <- data.frame(
  USUBJID = sprintf("SUBJ%03d", 1:50),
  AGE = round(rnorm(50, mean = 50, sd = 15)),
  SEX = sample(c("M", "F"), 50, replace = TRUE),
  TRT01A = sample(c("Placebo", "Low Dose", "High Dose"), 50, replace = TRUE, prob = c(0.3, 0.3, 0.4))
)

adlb <- data.frame(
  USUBJID = rep(adsl$USUBJID, each = 2),
  PARAMCD = rep(c("ALT", "AST"), times = 50),
  AVAL = c(rnorm(50, 30, 15), rnorm(50, 35, 12)),  # ALT and AST values
  BASE = c(rnorm(50, 28, 10), rnorm(50, 32, 8))    # Baseline values
)

adlb <- merge(adlb, adsl[, c("USUBJID", "TRT01A", "AGE")], by = "USUBJID")
2. Why Use directlabels?
- Adds labels directly to plot elements, reducing the need for legends.
- Helps avoid overlapping labels with minimal code.
- Useful for both scatterplots and line plots.
- Offers several methods for label placement (e.g., left, right, angled boxes).
3. Basic Usage: Labeling Points in Scatterplots
Let's use the adlb dataset to create a scatterplot showing the relationship between baseline and actual ALT values, with subject IDs labeled.
R Code:
# install.packages("directlabels")
library(ggplot2)
library(dplyr)
library(directlabels)

# Filter for ALT measurements
alt_data <- adlb %>% filter(PARAMCD == "ALT")

# Scatterplot with direct labels for ALT values
ggplot(alt_data, aes(BASE, AVAL, label = USUBJID)) +
  geom_point(color = "dodgerblue") +
  geom_dl(aes(label = USUBJID), method = "last.points") +
  labs(x = "Baseline ALT", y = "ALT Value") +
  theme_classic()
Expected Outcome:
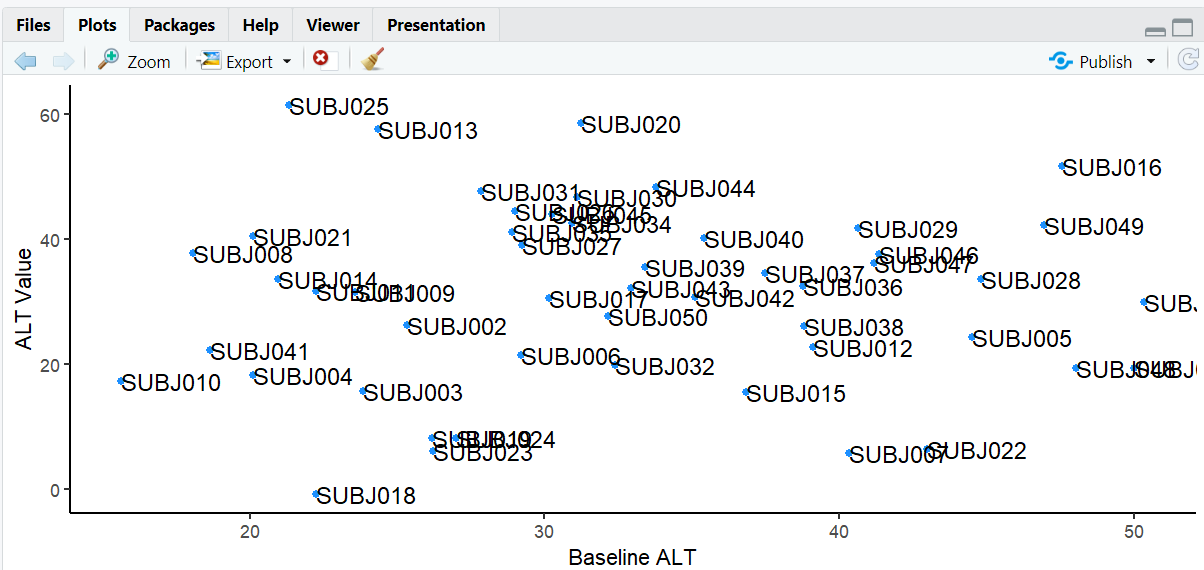
A scatterplot with direct labels for ALT values placed to the right of the points.
4. Labeling Lines in Line Plots
The directlabels package is especially useful for labeling lines, removing the need for a legend. Let's create a line plot showing ALT and AST trends by treatment group.
R Code:
# Line plot with direct labels for ALT and AST trends
ggplot(adlb, aes(BASE, AVAL, color = PARAMCD, group = PARAMCD)) +
  geom_line() +
  geom_dl(aes(label = PARAMCD), method = "angled.boxes") +
  labs(x = "Baseline Value", y = "Actual Value", title = "ALT and AST Trends by Treatment Group") +
  theme_minimal() +
  theme(legend.position = "none")
Expected Outcome:
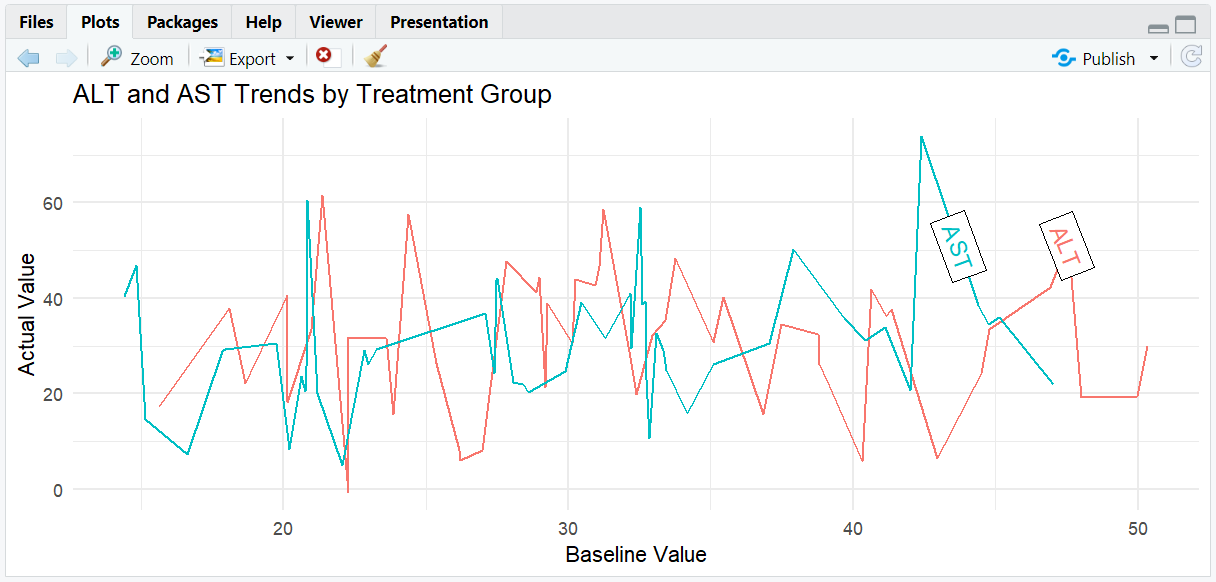
A line plot with each line labeled directly at the end, following the line's angle. No legend is needed.
5. Input and Output Table for directlabels Examples
| R Code Example | Input Data | Output (Plot/Description) |
|---|---|---|
geom_dl(method = "last.points") |
adlb (ALT) | Labels at right of selected points |
geom_dl(method = "angled.boxes") |
adlb (ALT/AST) | Labels at end of each line, angled |
6. Exploring Beyond Basic directlabels
- Try other methods:
"first.points","top.points","bottom.points","smart.grid", etc. - Adjust label size with
cex. - Combine with facets for multi-panel labeling.
- Use with other plot types (barplots, area plots) for direct labeling.
R Code Example:
# Faceted line plot with direct labels
ggplot(adlb, aes(BASE, AVAL, color = TRT01A, group = TRT01A)) +
  geom_line() +
  facet_wrap(~PARAMCD, scales = "free") +
  geom_dl(aes(label = TRT01A), method = "last.points") +
  labs(x = "Baseline Value", y = "Actual Value", title = "Trends by Treatment Group and Parameter") +
  theme_bw()
Expected Outcome:

A faceted line plot with direct labels for each treatment group, placed at the end of the lines.
7. Practice Problems
- Label only subjects with ALT values > 50 in a scatterplot.
- Use
geom_dl()to label the first point in each group in a line plot. - Remove the legend and use direct labels for all lines.
- Adjust label size and color for emphasis.
- Try different
directlabelsmethods and compare results.
8. Further Reading and Resources
- directlabels documentation
- directlabels reference manual
- R Graph Gallery: directlabels
- R for Data Science: Data Visualization