2.6.18. cowplot in R
1. Introduction
The cowplot package is designed to help you arrange multiple ggplot2 plots into a single grid and apply a consistent theme across all plots. This is especially useful for presentations and publications where you want your visualizations to look polished and consistent.
# Create a dummy ADAM dataset (ADLB - Laboratory Results Analysis Dataset)
set.seed(123)
adsl <- data.frame(
  USUBJID = sprintf("SUBJ%03d", 1:50),
  AGE = round(rnorm(50, mean = 50, sd = 15)),
  SEX = sample(c("M", "F"), 50, replace = TRUE),
  TRT01A = sample(c("Placebo", "Low Dose", "High Dose"), 50, replace = TRUE, prob = c(0.3, 0.3, 0.4))
)

adlb <- data.frame(
  USUBJID = rep(adsl$USUBJID, each = 2),
  PARAMCD = rep(c("ALT", "AST"), times = 50),
  AVAL = c(rnorm(50, 30, 15), rnorm(50, 35, 12)),  # ALT and AST values
  BASE = c(rnorm(50, 28, 10), rnorm(50, 32, 8))    # Baseline values
)

adlb <- merge(adlb, adsl[, c("USUBJID", "TRT01A", "AGE")], by = "USUBJID")
2. Why Use cowplot?
- Easily combine multiple ggplot2 plots into a grid.
- Apply a standard, clean theme (
theme_cowplot) to all plots. - Add labels, titles, and control relative sizes of plots.
- Simplifies the process of creating multi-panel figures for reports and presentations.
3. Applying a Consistent Theme
theme_cowplot()provides a clean, minimal look similar totheme_classic().- Removes background color and grid lines, leaving only axis lines.
R Code:
# install.packages("cowplot")
library(cowplot)
library(ggplot2)

# Scatterplot of ALT values by treatment group
p1 <- ggplot(adlb %>% filter(PARAMCD == "ALT"), aes(BASE, AVAL, color = TRT01A)) +
  geom_point() +
  labs(x = "Baseline ALT", y = "ALT Value", color = "Treatment") +
  theme_cowplot(12)

# Scatterplot of AST values by treatment group
p2 <- ggplot(adlb %>% filter(PARAMCD == "AST"), aes(BASE, AVAL, color = TRT01A)) +
  geom_point() +
  labs(x = "Baseline AST", y = "AST Value", color = "Treatment") +
  theme_cowplot(12)
Expected Outcome:
Two scatterplots with a consistent, clean theme and different parameters (ALT and AST).
4. Combining Multiple Plots
- Use
plot_grid()to arrange plots in a grid. - Control the number of columns or rows, and relative widths/heights.
R Code:
# Side-by-side
plot_grid(p1, p2, ncol = 2)

# Stacked vertically
plot_grid(p1, p2, ncol = 1)
Expected Outcome:


Plots arranged side by side or stacked, sharing the same theme.
5. Controlling Relative Sizes and Adding Labels
- Use
rel_widthsorrel_heightsto adjust plot sizes in the grid. - Add labels to plots for easy reference in reports.
R Code:
# Bar plot of ALT counts by treatment group
p3 <- ggplot(adlb %>% filter(PARAMCD == "ALT"), aes(TRT01A)) +
  geom_bar(fill = "dodgerblue") +
  labs(x = "Treatment Group", y = "Count") +
  theme_cowplot(12)

# Combine with relative widths and labels
plot_grid(p1, p3, rel_widths = c(1, 1.3), labels = c("A", "B"))
Expected Outcome:
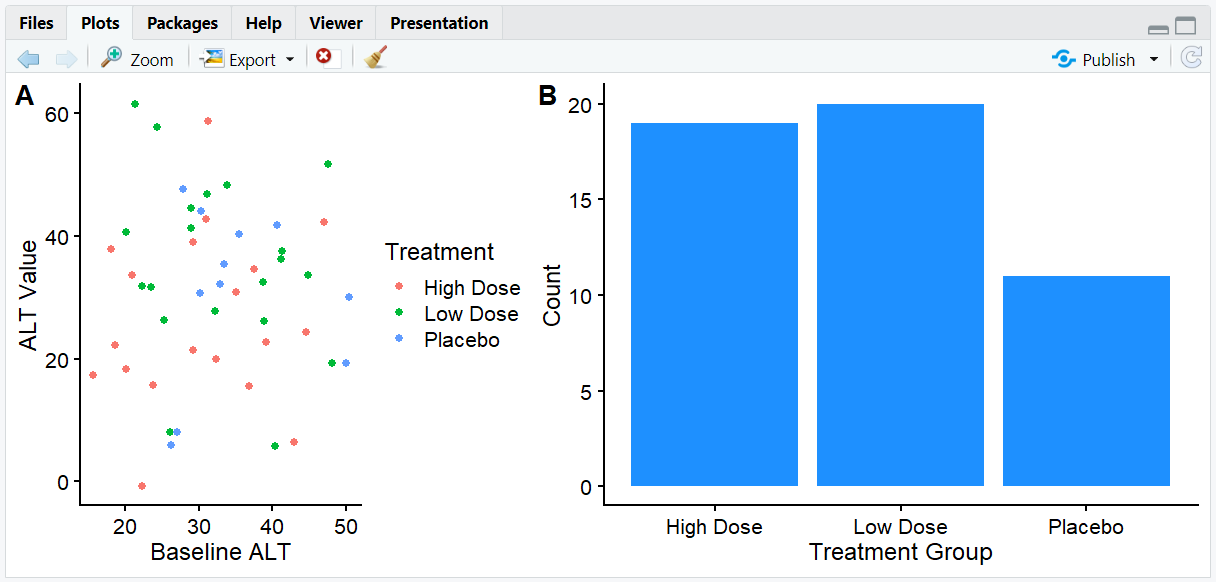
A grid with two plots, the right plot wider, and labeled "A" and "B".
6. Adding Joint Titles and Complex Layouts
- Use
draw_label()andggdraw()to add a shared title above a grid of plots. - Combine multiple plot grids for complex layouts.
R Code:
# Combine three plots with a shared title
first_col <- plot_grid(p1, p2, nrow = 2, labels = c('A', 'B'))
three_plots <- plot_grid(first_col, p3, ncol = 2, labels = c('', 'C'), rel_widths = c(1, 1.3))

title <- ggdraw() +
  draw_label("ALT and AST Trends by Treatment Group",
             fontface = 'bold', x = 0, hjust = 0) +
  theme(plot.margin = margin(0, 0, 0, 7))

# Add title above the grid
plot_grid(title, three_plots, ncol = 1, rel_heights = c(0.1, 1))
Expected Outcome:

A multi-panel figure with a shared title and labeled subplots, ready for publication or presentation.
7. Input and Output Table for cowplot Examples
| R Code Example | Input Data | Output (Plot/Description) |
|---|---|---|
theme_cowplot() |
adlb | Clean, minimal plot theme |
plot_grid(p1, p2) |
adlb | Plots arranged in a grid |
plot_grid(..., labels = ...) |
adlb | Labeled subplots |
draw_label() + plot_grid() |
adlb | Shared title above grid |
8. Exploring Beyond Basic cowplot
- Use
alignargument inplot_grid()to align axes. - Combine cowplot with patchwork or gridExtra for advanced layouts.
- Add annotations, legends, or insets to multi-panel figures.
- Explore cowplot's vignettes for more layout options.
9. Practice Problems
- Arrange three plots in a single row using
plot_grid(). - Add a shared title above a grid of plots.
- Make one plot twice as wide as the other in a grid.
- Label subplots with custom text.
- Combine cowplot with facets for a complex figure.
10. Further Reading and Resources
**Resource download links**
⁂