2.6.19. patchwork in R
1. Introduction
The patchwork package is a powerful tool for combining multiple ggplot2 plots into a single figure. It offers a flexible and intuitive syntax for arranging plots in grids, stacking, nesting, and customizing layouts, making it ideal for creating publication-ready multi-panel figures.
# Create a dummy ADAM dataset (ADLB - Laboratory Results Analysis Dataset)
set.seed(123)
adsl <- data.frame(
  USUBJID = sprintf("SUBJ%03d", 1:50),
  AGE = round(rnorm(50, mean = 50, sd = 15)),
  SEX = sample(c("M", "F"), 50, replace = TRUE),
  TRT01A = sample(c("Placebo", "Low Dose", "High Dose"), 50, replace = TRUE, prob = c(0.3, 0.3, 0.4))
)

adlb <- data.frame(
  USUBJID = rep(adsl$USUBJID, each = 2),
  PARAMCD = rep(c("ALT", "AST"), times = 50),
  AVAL = c(rnorm(50, 30, 15), rnorm(50, 35, 12)),  # ALT and AST values
  BASE = c(rnorm(50, 28, 10), rnorm(50, 32, 8))    # Baseline values
)

adlb <- merge(adlb, adsl[, c("USUBJID", "TRT01A", "AGE")], by = "USUBJID")
2. Why Use patchwork?
- Combine multiple ggplot2 plots with simple operators.
- Arrange plots side by side, stacked, or in complex layouts.
- Control relative sizes, spacing, and alignment.
- Collect and manage legends across plots.
- Apply themes and annotations to all or selected plots.
3. Basic Plot Combination Syntax
- Use
+to add plots together. - Use
|to place plots side by side. - Use
/to stack plots vertically. - Use parentheses to group plots for nesting.
R Code:
# install.packages("patchwork")
library(patchwork)
library(ggplot2)
# Scatterplot of ALT values by treatment group
p1 <- ggplot(adlb %>% filter(PARAMCD == "ALT"), aes(BASE, AVAL, color = TRT01A)) +
geom_point() +
labs(x = "Baseline ALT", y = "ALT Value", color = "Treatment") +
theme_minimal()
# Scatterplot of AST values by treatment group
p2 <- ggplot(adlb %>% filter(PARAMCD == "AST"), aes(BASE, AVAL, color = TRT01A)) +
geom_point() +
labs(x = "Baseline AST", y = "AST Value", color = "Treatment") +
theme_minimal()
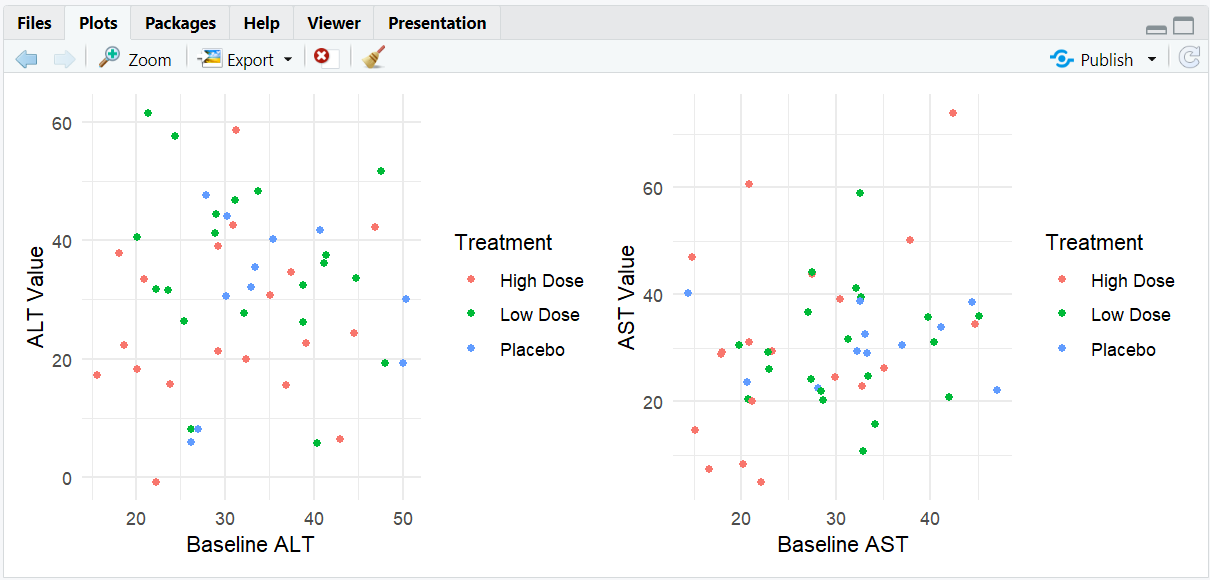
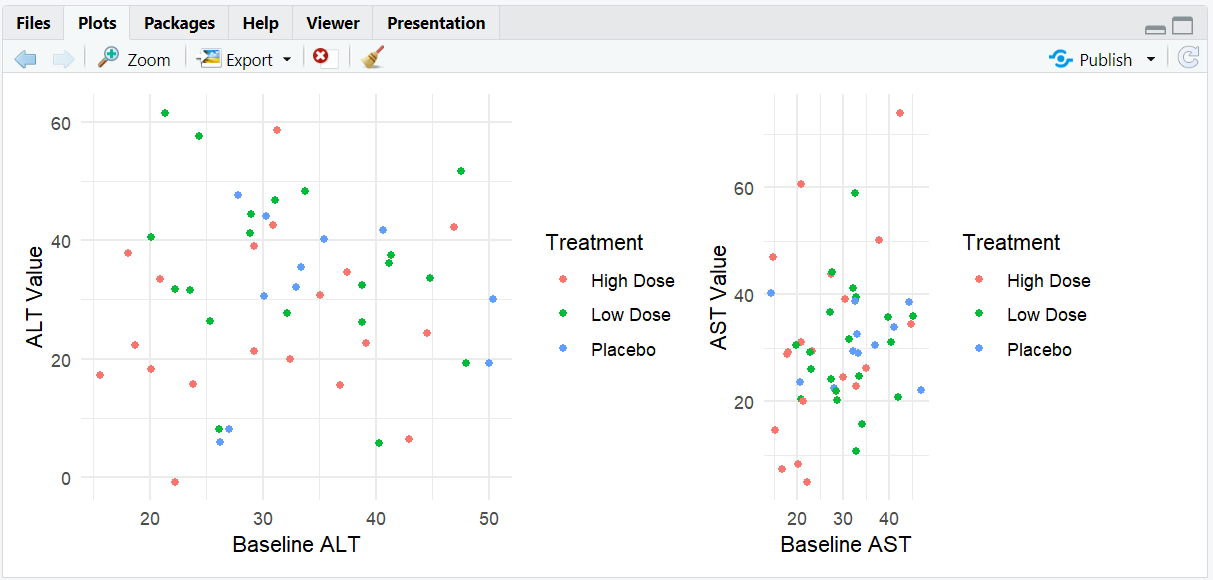
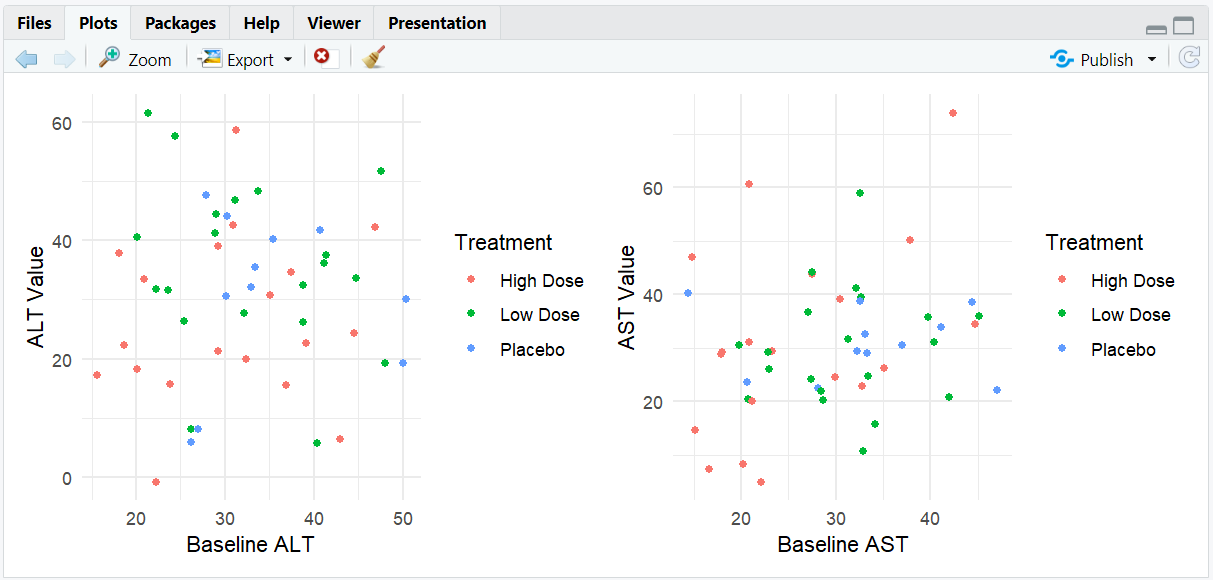
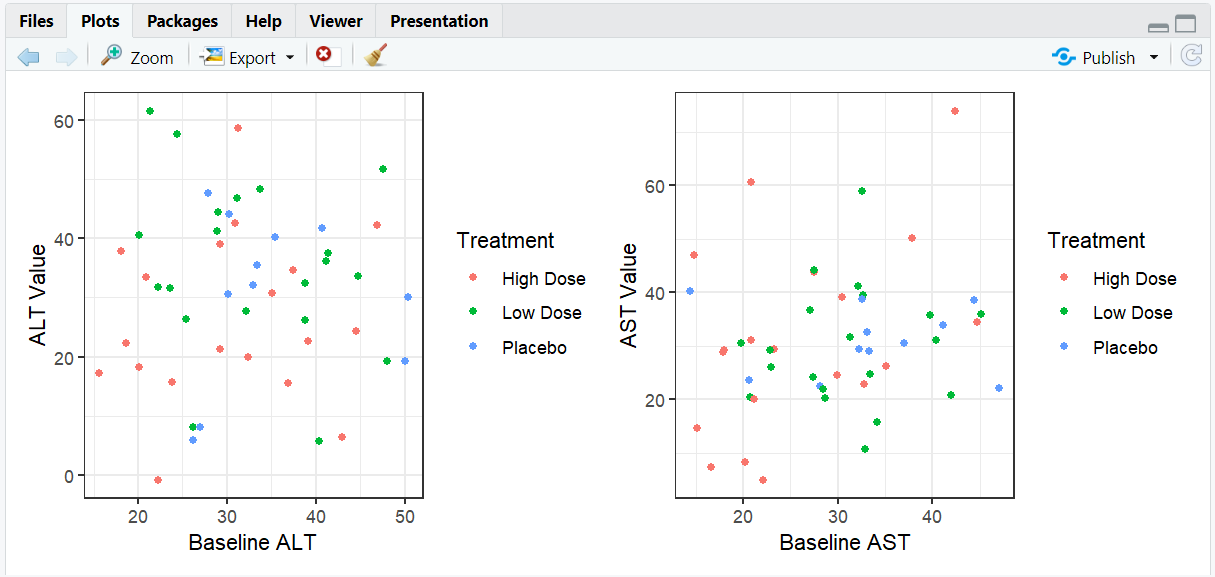
# Combine two plots side by side
p1 | p2
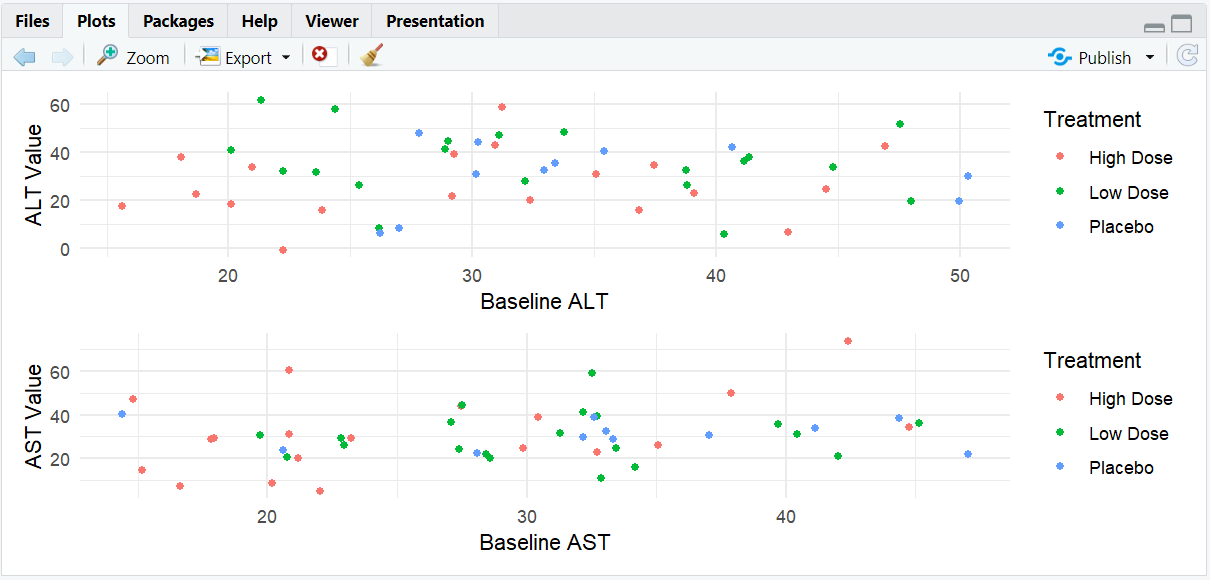
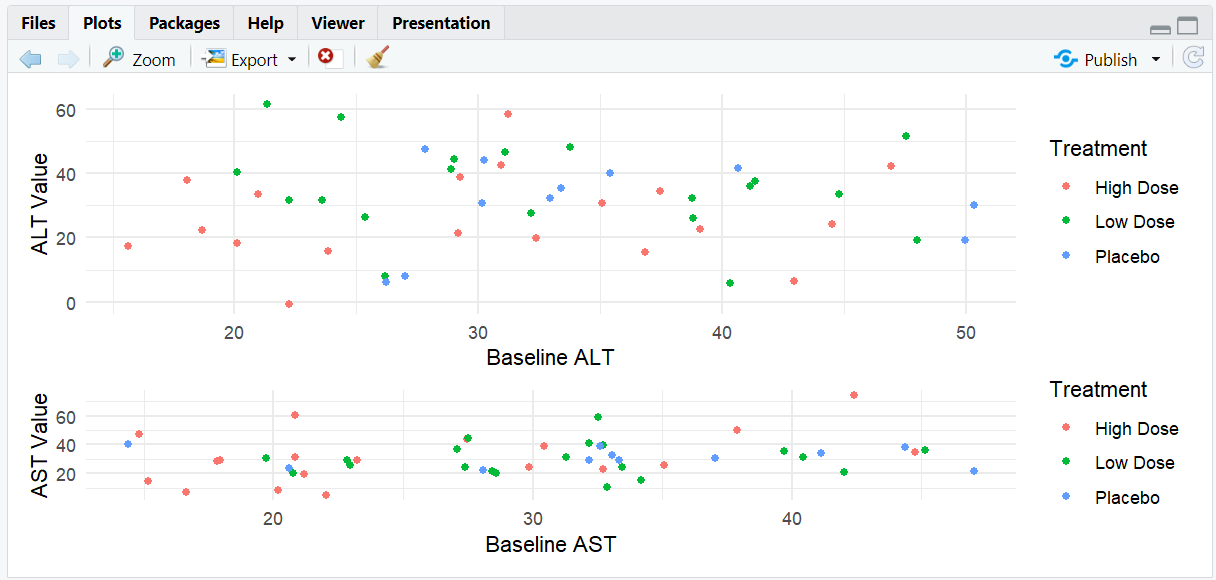
# Stack two plots vertically
p1 / p2
# Complex layout: two plots on top, one below
(p1 | p2) / p1
Expected Outcome:
Combine two plots side by side
Stack two plots vertically
Complex layout: two plots on top, one below
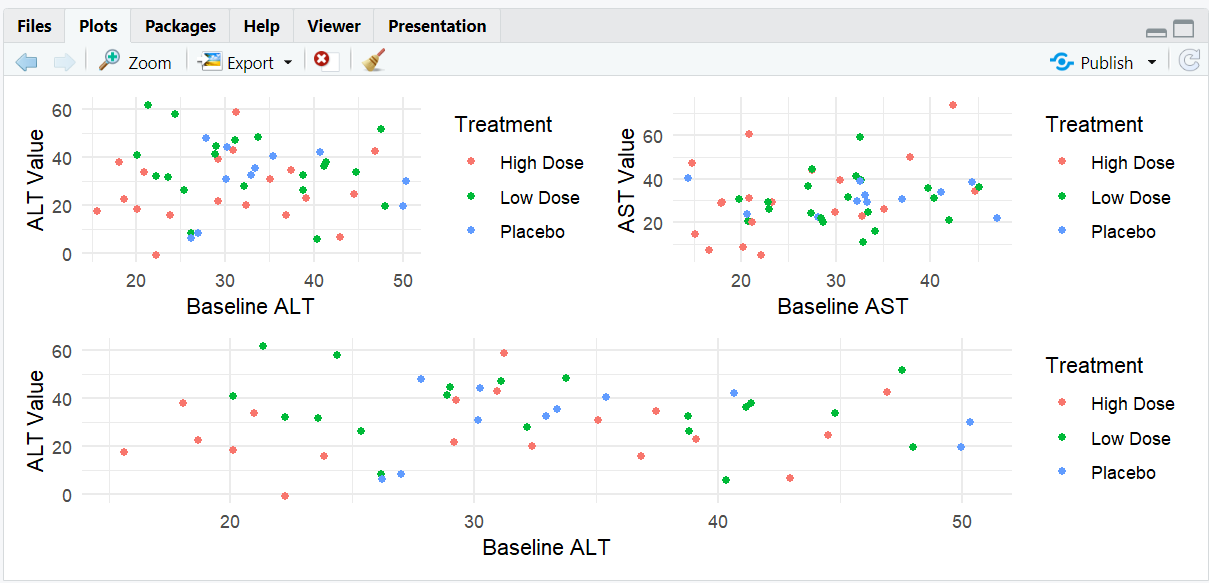
Plots arranged in the specified layout, sharing space as defined by the operators.
4. Empty Spaces and Spacers
- Use
plot_spacer()to add empty space in your layout.
R Code:
(plot_spacer() | p2 | plot_spacer()) / p1
Expected Outcome:
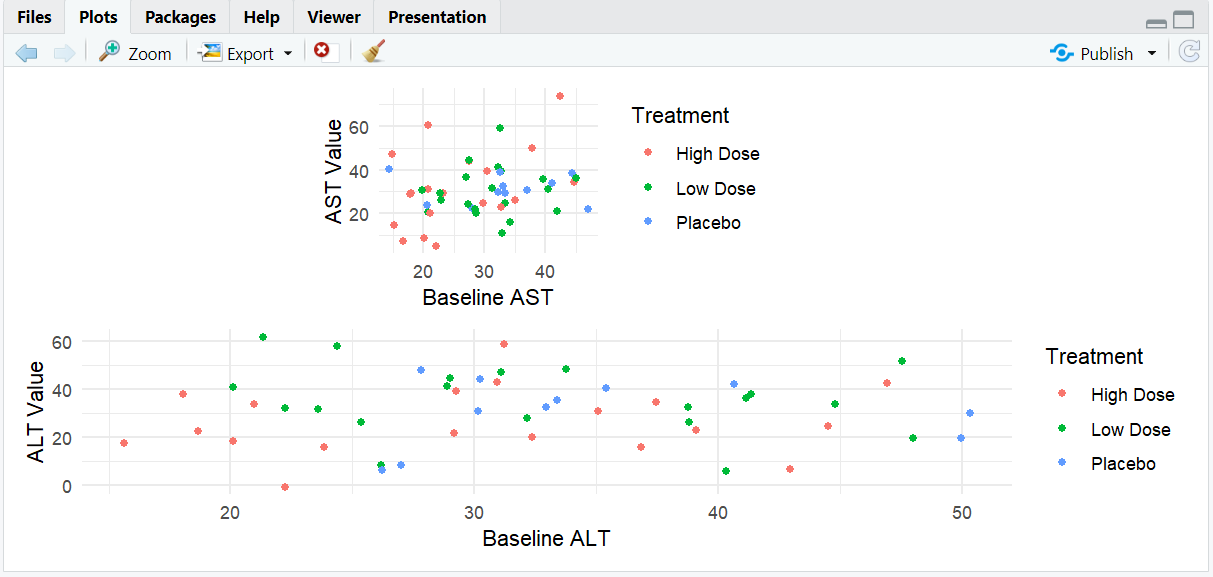
p2 is centered above p1 with empty space on either side.
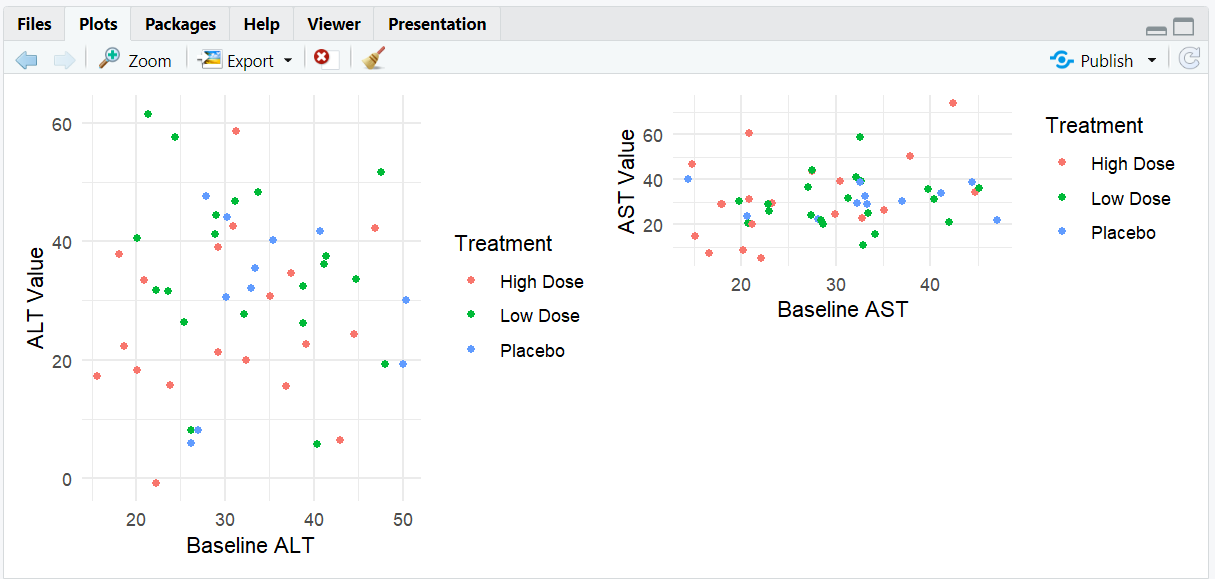
5. Controlling Plot Widths and Heights
- Use
plot_layout(widths = ...)andplot_layout(heights = ...)to control relative sizes.
R Code:
p1 | p2 + plot_layout(widths = c(2, 1))
p1 / p2 + plot_layout(heights = c(2, 1))
Expected Outcome:
The first plot is twice as wide (or tall) as the second.
6. Managing Legends and Layouts
- Use
plot_layout(guides = "collect")to gather legends in one place. - Specify number of rows/columns with
nrowandncol. - Use
byrow = FALSEto fill columns before rows.
R Code:
p1 | p2 + plot_layout(guides = "collect")
p1 | p2 + plot_layout(nrow = 2, guides = "collect")
Expected Outcome:
Legends are combined, and plots are arranged as specified.
7. Applying Themes to Plots
- Add a theme to the last plot before the theme call.
- Use
*to apply a theme to all nested plots. - Use
&to apply a theme to all plots in the layout.
R Code:
(p1 | p2) * theme_bw()
(p1 | p2) & theme(axis.title.x = element_text(face = "bold"))
Expected Outcome:
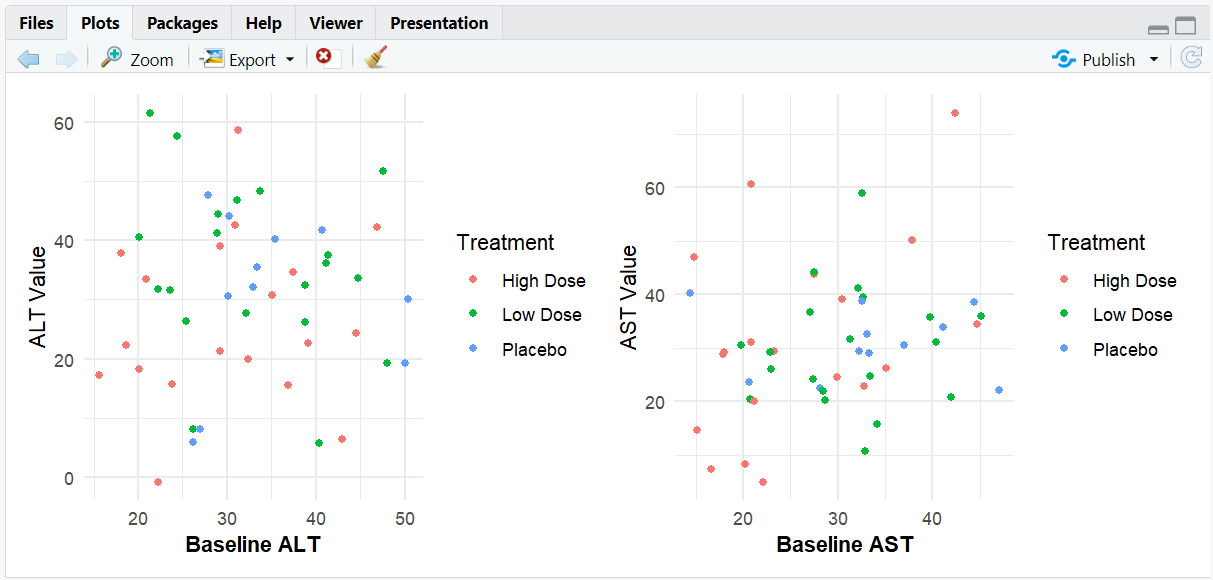
Themes are applied to the intended plots.
8. Adding Annotations to the Combined Plot
- Use
plot_annotation()to add a title or other annotation to the entire figure.
R Code:
(p1 | p2) + plot_annotation(
  title = "ALT and AST Trends by Treatment Group",
  theme = theme(plot.title = element_text(hjust = 0.5))
)
Expected Outcome:

A multi-panel figure with a shared title and custom theme.
9. Input and Output Table for patchwork Examples
Input and Output Table for patchwork Examples
| R Code Example | Input Data | Output (Plot/Description) |
|---|---|---|
p1 | p2 |
adlb | Plots side by side |
p1 / p2 |
adlb | Plots stacked vertically |
(p1 | p2) / p1 |
adlb | Nested layout |
p1 | p2 + plot_layout(widths = c(2,1)) |
adlb | Custom plot widths |
(p1 | p2) + plot_annotation(title = ...) |
adlb | Shared title |
10. Exploring Beyond Basic patchwork
- Combine patchwork with cowplot or gridExtra for advanced layouts.
- Use plot nesting for complex arrangements.
- Apply different themes to different plot groups.
- Add tags or labels to subplots for reference.
11. Practice Problems
- Arrange three plots in a 2x2 grid with one empty space.
- Collect all legends at the bottom of the combined plot.
- Apply a theme to all plots in a patchwork layout.
- Add a shared title and subtitle to a multi-panel figure.
- Use plot_spacer() to control plot spacing.
12. Further Reading and Resources
- patchwork documentation
- R Graph Gallery: patchwork
- R for Data Science: Communicate Results
- Fundamentals of Data Visualization