2.6.20. gganimate in R (with SDTM/ADaM Clinical Data)
Introduction
The gganimate package extends the grammar of graphics in ggplot2 to animated plots. This is especially useful in clinical trial data visualization, where you may want to show how patient measurements (e.g., lab values, vital signs) change over visits or by treatment group.
To get started, install and load the package:
install.packages("gganimate") # if not already installed
library(gganimate)
Key Grammar Classes in gganimate
transition_*(): Specifies how data should transition (e.g., by visit, treatment, or time).enter_*()/exit_*(): Controls how data appears and disappears.ease_aes(): Controls how different aesthetics are eased during transitions.view_*(): Controls how positional scales change.shadow_*(): Controls how previous frames are displayed (e.g., trails).
Example Data: Simulated ADaM/SDTM Datasets
We'll use simulated ADaM-like datasets for demonstration.
#install.packages(c("ggplot2", "gganimate", "gifski", "transformr"))


library(gganimate)
library(dplyr)

set.seed(123)
adsl <- data.frame(
  USUBJID = sprintf("SUBJ%03d", 1:50),
  AGE = round(rnorm(50, mean = 50, sd = 15)),
  SEX = sample(c("M", "F"), 50, replace = TRUE),
  TRT01P = sample(c("Placebo", "Low Dose", "High Dose"), 50, replace = TRUE)
)

visits <- c("BASELINE", "WEEK 1", "WEEK 4", "WEEK 12", "WEEK 24")
advs <- data.frame(
  USUBJID = rep(adsl$USUBJID, each = length(visits)),
  VISIT = rep(visits, times = nrow(adsl)),
  AVISIT = factor(rep(visits, times = nrow(adsl)), levels = visits),
  PARAMCD = "SYSBP",
  PARAM = "Systolic Blood Pressure (mmHg)",
  AVAL = NA,
  CHG = NA
)
for(i in 1:nrow(adsl)) {
  subj_rows <- advs$USUBJID == adsl$USUBJID[i]
  baseline_value <- 120 + rnorm(1, 0, 10)
  if(adsl$TRT01P[i] == "Placebo") {
    change <- c(0, rnorm(length(visits)-1, -2, 3))
  } else if(adsl$TRT01P[i] == "Low Dose") {
    change <- c(0, rnorm(length(visits)-1, -5, 3))
  } else {
    change <- c(0, rnorm(length(visits)-1, -10, 4))
  }
  advs$AVAL[subj_rows] <- baseline_value + cumsum(change)
  advs$CHG[subj_rows] <- c(0, diff(advs$AVAL[subj_rows]))
}
advs <- merge(advs, adsl[, c("USUBJID", "TRT01P")], by = "USUBJID")
Static Boxplot: Systolic BP by Treatment
library(ggplot2)
ggplot(advs) +
  geom_boxplot(aes(TRT01P, AVAL)) +
  labs(x = "Treatment Group", y = "Systolic Blood Pressure (mmHg)")

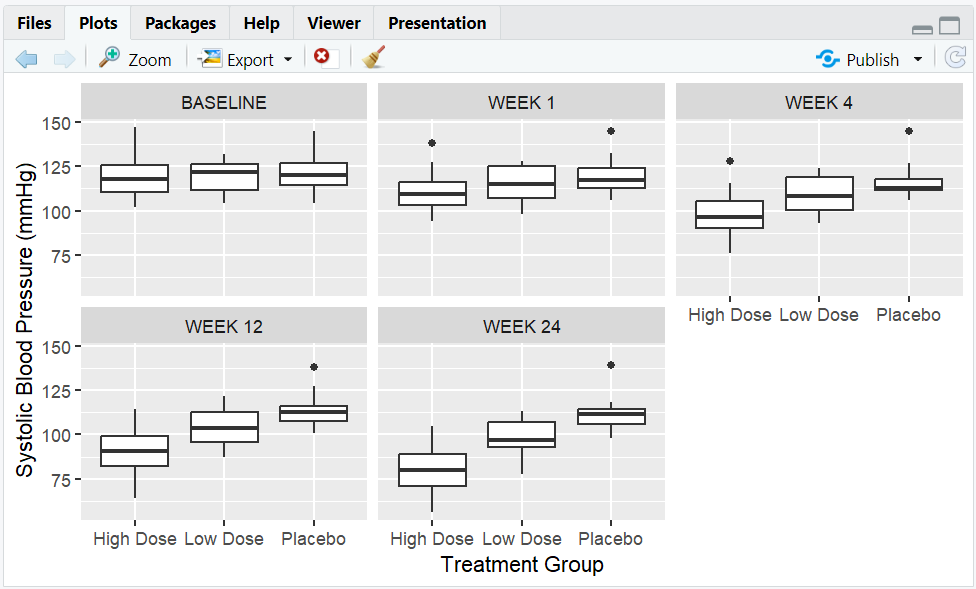
Facet by Visit
ggplot(advs) +
  geom_boxplot(aes(TRT01P, AVAL)) +
  facet_wrap(~AVISIT) +
  labs(x = "Treatment Group", y = "Systolic Blood Pressure (mmHg)")
Animated Boxplot: Transition by Visit
library(gganimate)
p <- ggplot(advs) +
  geom_boxplot(aes(TRT01P, AVAL)) +
  labs(x = "Treatment Group", y = "Systolic Blood Pressure (mmHg)") +
  transition_manual(AVISIT)

anim <- animate(p)
anim_save("boxplot_animation_1.gif", animation = anim)
- Explanation: Each frame shows the boxplot for a different visit.
Transitions: Using transition_states() for Finer Control
anim <- ggplot(advs) +
  geom_boxplot(aes(TRT01P, AVAL)) +
  labs(x = "Treatment Group", y = "Systolic Blood Pressure (mmHg)") +
  transition_states(AVISIT, transition_length = 2, state_length = 1)
anim
- Explanation: Smooth transition between visits.
Labeling Animation Frames
anim <- anim +
  labs(title = 'Now showing visit: {closest_state}')
anim
- Explanation: The current visit is shown in the animation title.
Easing: Smoother Transitions
anim <- anim +
  ease_aes('cubic-in-out')
anim
- Explanation: Animation starts and ends smoothly.
Enter & Exit Effects
anim <- anim +
  enter_fade() +
  exit_shrink()
anim

# Render and save as GIF
anim_gif <- animate(anim)
anim_save("boxplot_animation_2.gif", animation = anim_gif)
- Explanation: Data fades in and shrinks out during transitions.
Animating Scatterplots and Adjusting Scales
Static Scatterplot:
advs <- merge(advs, adsl[, c("USUBJID", "AGE")], by = "USUBJID", all.x = TRUE)

ggplot(advs %>% dplyr::filter(AVISIT == "BASELINE")) +
  geom_point(aes(AGE, AVAL, color = TRT01P)) +
  labs(x = "Age", y = "Systolic Blood Pressure (mmHg)", color = "Treatment")
Animated by Visit:
scat <- ggplot(advs) +
  geom_point(aes(AGE, AVAL, color = TRT01P)) +
  labs(x = "Age", y = "Systolic Blood Pressure (mmHg)", color = "Treatment") +
  transition_states(AVISIT, transition_length = 2, state_length = 1) +
  labs(title = 'Now showing visit: {closest_state}')

# Render animation and open in browser
anim_scat <- animate(scat)
anim_scat

# Save as GIF (open the GIF file to view)
anim_save("scatter_animation.gif", animation = anim_scat)
Allow Axes to Change:
scat_view <- scat +
  view_step(pause_length = 2, step_length = 1, nsteps = 3, include = FALSE)
anim_scat_view <- animate(scat_view)
anim_scat_view

anim_save("scatter_animation_1.gif", animation = anim_scat_view)
- Explanation: Axes adjust for each visit.
Example: Mean Systolic BP Over Time by Treatment
bp_means <- advs %>%
  mutate(visit_num = as.numeric(AVISIT)) %>%
  dplyr::group_by(TRT01P, visit_num) %>%
  dplyr::summarize(mean_bp = mean(AVAL, na.rm = TRUE), .groups = 'drop')

bp_plot <- ggplot(bp_means, aes(visit_num, mean_bp, group = TRT01P, color = TRT01P)) +
  geom_line(size = 1.2) +
  geom_point(size = 3) +
  labs(x = "Visit", y = "Mean Systolic BP (mmHg)", color = "Treatment",
       title = "Blood Pressure Changes Over Time") +
  theme_minimal(base_size = 12)
bp_plot <- bp_plot + transition_reveal(visit_num)
anim_scat_view <- animate(bp_plot)
anim_save("SYS_BP.gif", animation = anim_scat_view)
- Explanation: Animated line plot showing mean BP changes by treatment and visit.
Adding Shadows for Trails
bp_plot <- bp_plot +
  transition_reveal(visit_num) +
  shadow_trail(distance = 0.05, alpha = 0.3)

anim_scat_view <- animate(bp_plot)
anim_save("SYS_BP_1.gif", animation = anim_scat_view)

- Explanation: Previous frames leave a faint trail, showing trends over time.
Summary Table: gganimate Grammar Classes with Clinical Data
| gganimate Function | Clinical Example (Input) | Output/Description |
|---|---|---|
transition_manual() |
advs, AVISIT | Animate by visit (boxplot) |
transition_states() |
advs, AVISIT | Smooth transition by visit |
transition_reveal() |
bp_means, AVISIT | Reveal mean BP over time |
view_step() |
advs, AVISIT | Animated axes adjustment |
shadow_trail() |
bp_means, AVISIT | Trails showing BP change paths |
Practice Problems
- Animate a barplot of subject counts by treatment group and sex using ADSL.
- Add entry and exit effects to a scatterplot of lab values (e.g., ALT, AST) over time.
- Use
transition_time()to animate vital signs across visits. - Add a shadow trail to an animated plot of patient measurements.
- Export your animation as a GIF using
anim_save().
Further Reading and Resources
- gganimate documentation
- R Graph Gallery: gganimate
- R for Data Science: Communicate Results
- Fundamentals of Data Visualization
**Resource download links**
⁂