3.1.6. R Shiny Reactive Programming
R Shiny's reactive programming approach makes building interactive web applications simple and intuitive. This beginner's guide explores the five core reactive concepts with straightforward explanations and simple examples to help you get started quickly.
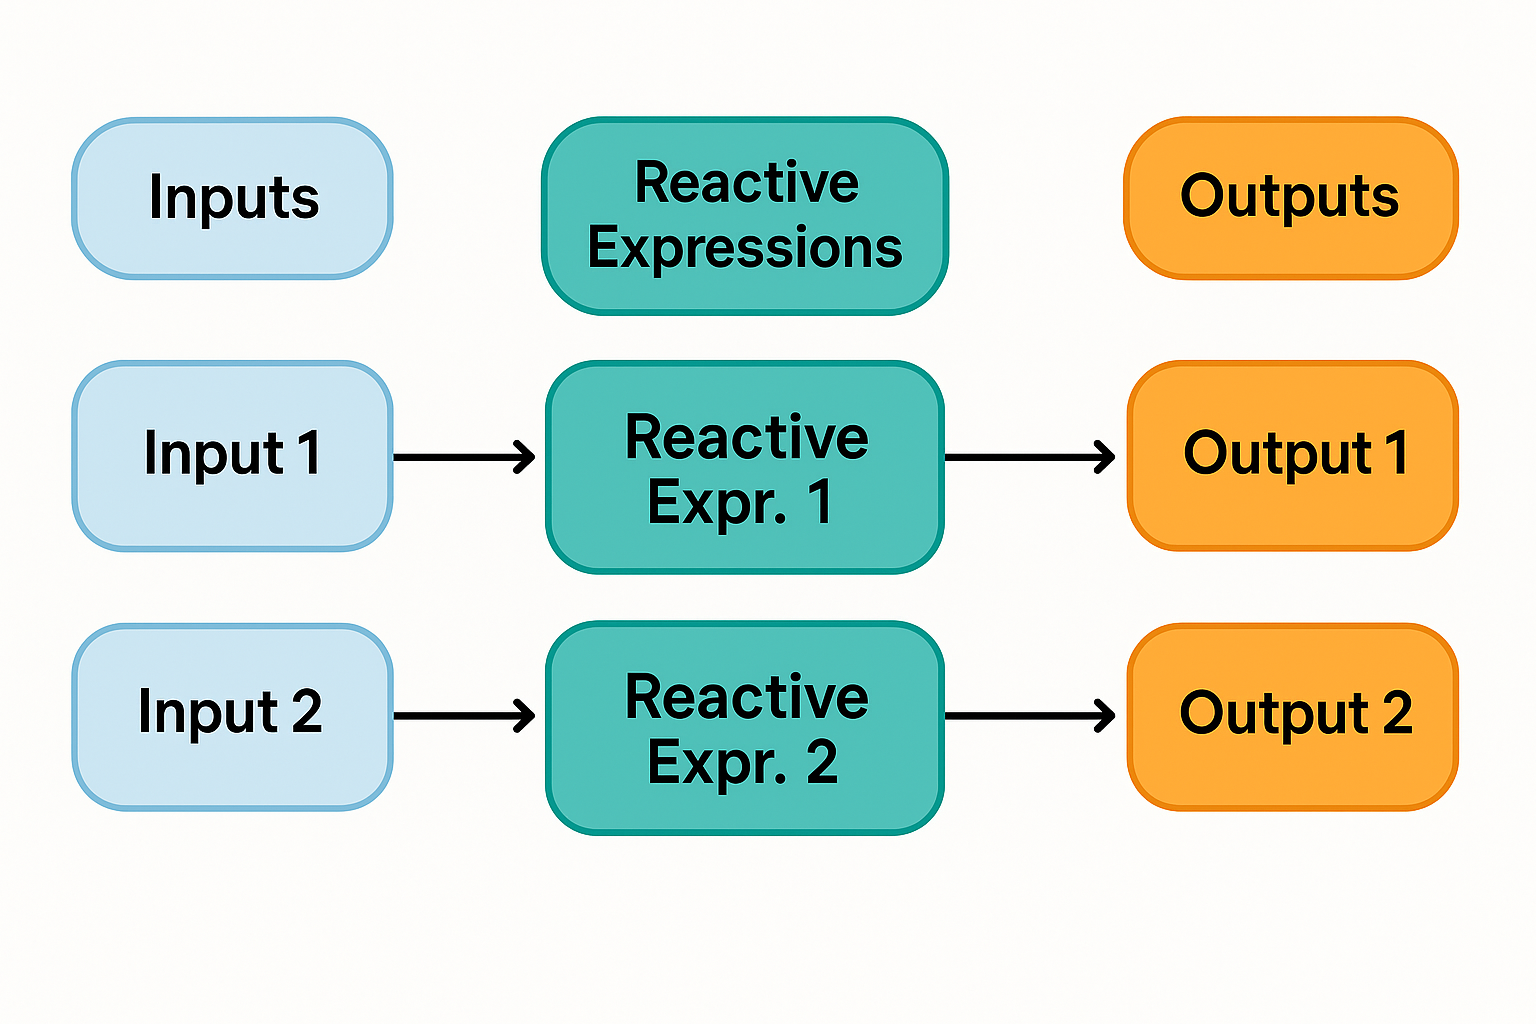
1. Reactive Inputs and Outputs: The Foundation
1.1. Understanding Reactive Inputs
Reactive inputs capture user interactions and make them available to your Shiny app. When a user changes an input, Shiny automatically updates any related outputs.
1.1.1. Basic Input Types
- textInput(): Captures text entered by the user
- sliderInput(): Allows selection of numeric values with a slider
- selectInput(): Provides dropdown selection options
- checkboxInput(): Simple yes/no toggle
library(shiny)

# Simple inputs demonstration
ui <- fluidPage(
  titlePanel("Basic Input Examples"),

  sidebarLayout(
    sidebarPanel(
      # Text input - captures text the user types
      textInput(inputId = "user_name",
               label = "Your name:",
               value = ""),

      # Slider input - select a number with a slider
      sliderInput(inputId = "age",
                 label = "Your age:",
                 min = 0, max = 100, value = 25),

      # Select input - dropdown menu for selection
      selectInput(inputId = "favorite_color",
                 label = "Favorite color:",
                 choices = c("Red", "Blue", "Green", "Yellow")),

      # Checkbox input - simple yes/no choice
      checkboxInput(inputId = "subscribe",
                   label = "Subscribe to newsletter",
                   value = FALSE)
    ),

    mainPanel(
      h3("Your Information:"),
      # These outputs will automatically update when inputs change
      p("Name:"), textOutput("name_output"),
      p("Age:"), textOutput("age_output"),
      p("Favorite color:"), textOutput("color_output"),
      p("Newsletter:"), textOutput("subscribe_output")
    )
  )
)

server <- function(input, output) {
  # Each output is connected to an input
  # When the input changes, the output automatically updates

  output$name_output <- renderText({
    input$user_name  # This will update whenever user_name changes
  })

  output$age_output <- renderText({
    input$age  # This will update whenever age changes
  })

  output$color_output <- renderText({
    input$favorite_color  # This will update whenever favorite_color changes
  })

  output$subscribe_output <- renderText({
    if(input$subscribe) {
      "Yes, subscribed!"
    } else {
      "Not subscribed"
    }
  })
}

shinyApp(ui, server)

1.2. Understanding Reactive Outputs
Reactive outputs display results to users and automatically update when their dependent inputs change.
1.2.1. Common Output Functions
- renderText(): Displays text
- renderPrint(): Shows printed R output
- renderPlot(): Displays charts and plots
- renderTable(): Shows tabular data
library(shiny)

ui <- fluidPage(
  titlePanel("Basic Output Examples"),

  sidebarLayout(
    sidebarPanel(
      # Create a simple number input
      numericInput(inputId = "number",
                  label = "Enter a number:",
                  value = 5),

      # Add a slider to control plot points
      sliderInput(inputId = "points",
                 label = "Number of points:",
                 min = 10, max = 100, value = 50)
    ),

    mainPanel(
      h3("Different Types of Outputs:"),

      # Text output - simple text
      h4("Text Output:"),
      textOutput("text_result"),

      # Print output - shows output like R console would
      h4("Print Output:"),
      verbatimTextOutput("print_result"),

      # Table output - shows tabular data
      h4("Table Output:"),
      tableOutput("table_result"),

      # Plot output - shows charts and graphs
      h4("Plot Output:"),
      plotOutput("plot_result")
    )
  )
)

server <- function(input, output) {
  # Text output - just shows the text
  output$text_result <- renderText({
    paste("The square of", input$number, "is", input$number^2)
  })

  # Print output - shows output like R console would
  output$print_result <- renderPrint({
    summary(1:input$number)
  })

  # Table output - shows tabular data
  output$table_result <- renderTable({
    # Create a simple data frame based on input
    data.frame(
      Value = c(input$number, input$number^2, input$number^3),
      Operation = c("Original", "Squared", "Cubed")
    )
  })

  # Plot output - shows a graph
  output$plot_result <- renderPlot({
    # Create a simple plot based on inputs
    plot(
      x = 1:input$points,
      y = rnorm(input$points, mean = input$number),
      main = paste("Plot with mean =", input$number),
      xlab = "X axis",
      ylab = "Y axis"
    )
  })
}

shinyApp(ui, server)
2. Reactive Expressions: The Computational Engine
Reactive expressions let you calculate values that depend on inputs, then reuse those calculations in multiple places. They're "lazy" - they only recalculate when needed.
2.1. Understanding reactive()
The reactive() function creates a calculation that:
- Updates automatically when its inputs change
- Only updates when needed (lazy evaluation)
- Caches its result so it's not calculated twice unnecessarily
library(shiny)

ui <- fluidPage(
  titlePanel("Simple Reactive Expression Example"),

  sidebarLayout(
    sidebarPanel(
      # Create two simple inputs
      numericInput("x", "Enter x:", 5),
      numericInput("y", "Enter y:", 10),

      hr(), # Horizontal line

      # Add checkbox to show/hide expensive calculation
      checkboxInput("show_expensive", "Show expensive calculation", FALSE)
    ),

    mainPanel(
      h3("Basic calculations"),

      # Results will be shown here
      p("x + y ="), textOutput("sum"),
      p("x * y ="), textOutput("product"),
      p("x² + y² ="), textOutput("sum_of_squares"),

      # Conditional panel for expensive calculation
      conditionalPanel(
        condition = "input.show_expensive == true",
        h3("Expensive calculation"),
        p("This calculation is only performed when needed"),
        verbatimTextOutput("expensive_result")
      )
    )
  )
)

server <- function(input, output) {
  # REACTIVE EXPRESSION:
  # This calculation is stored and can be reused in multiple outputs
  # It only recalculates when x or y change
  calculations <- reactive({
    # In a real app, this might be an expensive computation
    cat("Performing basic calculations...\n")

    list(
      sum = input$x + input$y,
      product = input$x * input$y,
      sum_of_squares = input$x^2 + input$y^2
    )
  })

  # Expensive calculation - only runs when checkbox is checked
  expensive_calc <- reactive({
    # This simulates a more intensive calculation
    cat("Performing expensive calculation...\n")

    # Simulate computation time
    Sys.sleep(1)

    # Calculate some complex result
    result <- 0
    for(i in 1:100) {
      result <- result + sqrt(input$x^2 * i + input$y^2 * i)
    }

    result
  })

  # OUTPUTS:
  # These all use the same reactive calculation

  output$sum <- renderText({
    # Use the "sum" value from our calculations
    calculations()$sum
  })

  output$product <- renderText({
    # Use the "product" value from our calculations
    calculations()$product
  })

  output$sum_of_squares <- renderText({
    # Use the "sum_of_squares" value from our calculations
    calculations()$sum_of_squares
  })

  output$expensive_result <- renderPrint({
    # This only runs when the checkbox is checked
    # Otherwise, expensive_calc() is never called
    result <- expensive_calc()

    cat("Result of expensive calculation:", result, "\n")
    cat("(Notice this only runs when the tab is visible)")
  })
}

shinyApp(ui, server)
2.2. Understanding reactiveVal() and reactiveValues()
These functions create reactive containers that you can modify programmatically.
- reactiveVal(): Stores a single reactive value
- reactiveValues(): Stores multiple reactive values as a list
library(shiny)

ui <- fluidPage(
  titlePanel("Counter Example with reactiveVal"),

  sidebarLayout(
    sidebarPanel(
      # Buttons to control the counter
      actionButton("increment", "Add 1"),
      actionButton("decrement", "Subtract 1"),
      actionButton("reset", "Reset to 0"),

      hr(),

      # Input to set counter directly
      numericInput("new_value", "Set counter to:", 0),
      actionButton("set_value", "Set")
    ),

    mainPanel(
      # Display the current count
      h3("Current counter value:"),
      h1(textOutput("counter_value"), align = "center"),

      hr(),

      # Display history of changes
      h3("History:"),
      verbatimTextOutput("counter_history")
    )
  )
)

server <- function(input, output) {
  # Create a reactiveVal to store the counter
  # This is a single value that can change over time
  counter <- reactiveVal(0)

  # Create a reactiveValues to store history
  history <- reactiveValues(
    actions = character(0),
    timestamps = character(0)
  )

  # Helper function to add to history
  add_history <- function(action) {
    current_actions <- history$actions
    current_timestamps <- history$timestamps

    new_action <- paste(Sys.time(), "-", action, "- Counter:", counter())
    new_timestamp <- format(Sys.time(), "%H:%M:%S")

    history$actions <- c(new_action, current_actions)[1:min(length(current_actions) + 1, 10)]
    history$timestamps <- c(new_timestamp, current_timestamps)[1:min(length(current_timestamps) + 1, 10)]
  }

  # Increment button
  observeEvent(input$increment, {
    counter(counter() + 1)  # Increase counter by 1
    add_history("Added 1")  # Record action in history
  })

  # Decrement button
  observeEvent(input$decrement, {
    counter(counter() - 1)  # Decrease counter by 1
    add_history("Subtracted 1")  # Record action in history
  })

  # Reset button
  observeEvent(input$reset, {
    counter(0)  # Set counter to 0
    add_history("Reset to 0")  # Record action in history
  })

  # Set value button
  observeEvent(input$set_value, {
    counter(input$new_value)  # Set counter to input value
    add_history(paste("Set to", input$new_value))  # Record action in history
  })

  # Output for counter value
  output$counter_value <- renderText({
    counter()  # Just display the current counter value
  })

  # Output for history
  output$counter_history <- renderPrint({
    # Print the history entries with timestamps
    if(length(history$actions) == 0) {
      cat("No actions yet")
    } else {
      for(i in seq_along(history$actions)) {
        cat(history$timestamps[i], ": ", history$actions[i], "\n")
      }
    }
  })
}

shinyApp(ui, server)
3. Observers: Side Effects and Actions
Observers are used to perform actions in response to changes, like updating UI, saving data, or showing notifications.
3.1. Understanding observe()
The observe() function:
- Runs automatically when its reactive dependencies change
- Doesn't return a value (used for actions/side effects)
- Is useful for tasks that don't produce outputs directly
library(shiny)
library(shinyjs)  # For additional UI manipulation

ui <- fluidPage(
  useShinyjs(),  # Initialize shinyjs

  titlePanel("Simple Observer Example"),

  sidebarLayout(
    sidebarPanel(
      # Create inputs
      textInput("username", "Enter username:"),
      passwordInput("password", "Enter password:"),

      # Color picker
      selectInput("bg_color", "Background color:",
                  choices = c("white", "lightyellow", "lightblue", "lightpink")),

      # Enable/disable feature
      checkboxInput("enable_feature", "Enable special feature", FALSE)
    ),

    mainPanel(
      # Create a UI element that will be modified by an observer
      div(id = "welcome_message",
          h3("Welcome!"),
          p("Please enter your username to personalize this app.")),

      # Create a UI element for messages
      div(id = "message_box",
          style = "padding: 10px; border: 1px solid #ddd; margin-top: 20px;",
          p("Status messages will appear here.")),

      # Special feature section (initially hidden)
      hidden(
        div(id = "special_feature",
            h3("Special Feature"),
            p("This section is only visible when enabled."),
            plotOutput("feature_plot"))
      )
    )
  )
)

server <- function(input, output) {
  # OBSERVER 1: Update welcome message when username changes
  observe({
    # This code runs automatically whenever username changes
    username <- input$username

    if (nchar(username) > 0) {
      # Update the welcome message with the username
      html("welcome_message",
           paste0("<div class='custom-h3'>Welcome, ", username, "!</div>",
                  "<p>Thank you for using our app.</p>"))
    } else {
      # Reset to default if username is empty
      html("welcome_message",
           paste0("<div class='custom-h3'>Welcome!</div>",
                  "<p>Please enter your username to personalize this app.</p>"))
    }
  })

  # OBSERVER 2: Change background color
  observe({
    # This runs whenever bg_color input changes
    color <- input$bg_color

    # Apply the selected color to the page background
    runjs(paste0("document.body.style.backgroundColor = '", color, "';"))

    # Also update message box with the current selection
    html("message_box",
         paste0("<p><strong>Background updated:</strong> You selected ", color, ".</p>"))
  })

  # OBSERVER 3: Toggle special feature visibility
  observe({
    if (input$enable_feature) {
      # Show the special feature section
      show("special_feature")
      html("message_box", "<p><strong>Feature enabled!</strong> The special feature is now visible.</p>")
    } else {
      # Hide the special feature section
      hide("special_feature")
      html("message_box", "<p>The special feature is currently disabled.</p>")
    }
  })

  # Special feature plot
  output$feature_plot <- renderPlot({
    # Generate a simple plot
    plot(1:10, 1:10,
         main = "Special Feature Plot",
         xlab = "X axis", ylab = "Y axis",
         col = "blue", pch = 16)
  })
}

shinyApp(ui, server)
3.2. Understanding observeEvent()
observeEvent() is similar to observe(), but it only triggers when specific events occur, like button clicks.
library(shiny)

ui <- fluidPage(
  titlePanel("observeEvent Example"),

  sidebarLayout(
    sidebarPanel(
      # Text input
      textInput("note", "Enter a note:"),

      # Action buttons
      actionButton("save", "Save Note"),
      actionButton("clear", "Clear All Notes"),

      hr(),

      # Simple inputs that won't trigger events
      sliderInput("size", "Font size:", min = 10, max = 30, value = 14),
      selectInput("color", "Text color:",
                 choices = c("black", "blue", "red", "green"))
    ),

    mainPanel(
      # Display the saved notes
      h3("Saved Notes:"),
      tags$div(id = "notes_area",
              style = "border: 1px solid #ddd; padding: 10px; min-height: 200px;"),

      hr(),

      # Display event log
      h3("Event Log:"),
      verbatimTextOutput("event_log")
    )
  )
)

server <- function(input, output) {
  # Create reactive values to store data
  values <- reactiveValues(
    notes = character(0),  # Array to store notes
    log = character(0)     # Array to store event log
  )

  # Add to log helper function
  add_log_entry <- function(message) {
    timestamp <- format(Sys.time(), "%H:%M:%S")
    log_entry <- paste0(timestamp, ": ", message)
    values$log <- c(log_entry, values$log)  # Add to beginning of log

    # Keep log at a reasonable size
    if(length(values$log) > 10) {
      values$log <- values$log[1:10]
    }
  }

  # OBSERVE EVENT 1: Save button - only triggers when 'save' button is clicked
  observeEvent(input$save, {
    # Get current note
    current_note <- input$note

    if(nchar(current_note) > 0) {
      # Add timestamp
      timestamped_note <- paste0(
        format(Sys.time(), "%H:%M:%S"), " - ", current_note
      )

      # Add to notes list
      values$notes <- c(values$notes, timestamped_note)

      # Log the action
      add_log_entry(paste("Saved note:", current_note))

      # Update the displayed notes
      updateNotes()
    } else {
      # Log empty note attempt
      add_log_entry("Attempted to save empty note (ignored)")
    }
  })

  # OBSERVE EVENT 2: Clear button - only triggers when 'clear' button is clicked
  observeEvent(input$clear, {
    # Clear all notes
    values$notes <- character(0)

    # Log the action
    add_log_entry("Cleared all notes")

    # Update the displayed notes (clear them)
    updateNotes()
  })

  # Helper function to update notes display
  updateNotes <- function() {
    if(length(values$notes) == 0) {
      # No notes message
      html <- "<p><em>No notes saved yet.</em></p>"
    } else {
      # Build HTML for the notes
      html <- "<ul>"
      for(note in values$notes) {
        # Apply styling based on inputs
        style <- paste0(
          "color: ", input$color, "; ",
          "font-size: ", input$size, "px;"
        )
        html <- paste0(html, "<li style='", style, "'>", note, "</li>")
      }
      html <- paste0(html, "</ul>")
    }

    # Update the notes area
    shiny::insertUI(
      selector = "#notes_area",
      where = "beforeEnd",
      ui = HTML(html),
      immediate = TRUE,
      session = getDefaultReactiveDomain()
    )

    # First remove old content
    shiny::removeUI(
      selector = "#notes_area > *",
      immediate = TRUE,
      session = getDefaultReactiveDomain()
    )

    # Then insert new content
    shiny::insertUI(
      selector = "#notes_area",
      where = "beforeEnd",
      ui = HTML(html),
      immediate = TRUE,
      session = getDefaultReactiveDomain()
    )
  }

  # Display the event log
  output$event_log <- renderPrint({
    if(length(values$log) == 0) {
      cat("No events yet")
    } else {
      cat(values$log, sep = "\n")
    }
  })
}

shinyApp(ui, server)

4. Event-driven Reactivity: Controlled Updates
Event-driven reactivity lets you control when calculations happen, typically in response to specific user actions.
4.1. Understanding eventReactive()
eventReactive() creates reactive expressions that only update when specific events occur, like button clicks.
library(shiny)

ui <- fluidPage(
  titlePanel("eventReactive Example - Simple Calculator"),

  sidebarLayout(
    sidebarPanel(
      # Inputs for calculation
      numericInput("num1", "First number:", 5),
      numericInput("num2", "Second number:", 3),
      selectInput("operation", "Operation:",
                 choices = c("Add" = "add",
                            "Subtract" = "subtract",
                            "Multiply" = "multiply",
                            "Divide" = "divide")),

      # Button to trigger calculation
      actionButton("calculate", "Calculate"),

      hr(),

      # Additional inputs that will NOT trigger recalculation
      selectInput("result_color", "Result color:",
                 choices = c("black", "blue", "red", "green")),

      # Help text
      helpText("Notice how changing the numbers or operation doesn't update the result.",
               "Only clicking the Calculate button updates the result.")
    ),

    mainPanel(
      # Results panel
      wellPanel(
        h3("Calculation Result:"),
        textOutput("calculation_text"),
        h1(textOutput("calculation_result")),

        hr(),

        h4("Calculation History:"),
        tableOutput("calculation_history")
      ),

      # Explanation
      h3("How eventReactive Works:"),
      p("The calculation is only performed when you click the Calculate button, not when you change the inputs."),
      p("This is different from regular reactivity, where results update immediately when inputs change."),
      p("Use eventReactive when:"),
      tags$ul(
        tags$li("You want to perform expensive calculations only when requested"),
        tags$li("You need to gather all inputs before processing"),
        tags$li("You want to give the user control over when updates happen")
      )
    )
  )
)

server <- function(input, output) {
  # Create reactive values to store history
  values <- reactiveValues(
    history = data.frame(
      Time = character(),
      Calculation = character(),
      Result = numeric(),
      stringsAsFactors = FALSE
    )
  )

  # EVENT REACTIVE: Only calculates when the calculate button is clicked
  calculation <- eventReactive(input$calculate, {
    # Get current inputs
    num1 <- input$num1
    num2 <- input$num2
    op <- input$operation

    # Perform calculation based on selected operation
    result <- switch(op,
                    "add" = num1 + num2,
                    "subtract" = num1 - num2,
                    "multiply" = num1 * num2,
                    "divide" = if(num2 == 0) "Error: Division by zero" else num1 / num2)

    # Create description of the calculation
    description <- switch(op,
                         "add" = paste(num1, "+", num2),
                         "subtract" = paste(num1, "-", num2),
                         "multiply" = paste(num1, "×", num2),
                         "divide" = paste(num1, "÷", num2))

    # Add to history
    values$history <- rbind(
      data.frame(
        Time = format(Sys.time(), "%H:%M:%S"),
        Calculation = description,
        Result = if(is.numeric(result)) round(result, 2) else result,
        stringsAsFactors = FALSE
      ),
      values$history
    )

    # Keep only the most recent 10 calculations
    if(nrow(values$history) > 10) {
      values$history <- values$history[1:10,]
    }

    # Return a list with all relevant information
    list(
      result = result,
      description = description,
      num1 = num1,
      num2 = num2,
      operation = op
    )
  })

  # Text output with calculation description
  output$calculation_text <- renderText({
    calc <- calculation()
    calc$description
  })

  # Result output with the actual result
  output$calculation_result <- renderText({
    calc <- calculation()

    # Apply the selected color
    color <- input$result_color

    # Add HTML to colorize the text
    paste0('<span style="color:', color, ';">', calc$result, '</span>')
  })

  # History table
  output$calculation_history <- renderTable({
    values$history
  })
}

shinyApp(ui, server)

4.2. Input Validation with req() and validate()
These functions help handle cases where inputs are missing or invalid.
library(shiny)

ui <- fluidPage(
  titlePanel("Input Validation Example"),

  sidebarLayout(
    sidebarPanel(
      # Input that must be validated
      textInput("email", "Email address:"),
      numericInput("age", "Age:", value = NA),
      selectInput("country", "Country:",
                 choices = c("Select a country" = "",
                            "USA", "Canada", "Mexico", "Other")),

      # Submit button
      actionButton("submit", "Submit Form")
    ),

    mainPanel(
      # Area for validation messages
      h3("Validation Results:"),
      verbatimTextOutput("validation_result"),

      # Area for form data (only shown when valid)
      h3("Submitted Data:"),
      tableOutput("submitted_data")
    )
  )
)

server <- function(input, output) {
  # Form submission with validation
  form_data <- eventReactive(input$submit, {
    # Validate email (simple check for @ symbol)
    validate(
      need(grepl("@", input$email), "Please enter a valid email address (must contain @)")
    )

    # Validate age (must be between 18 and 120)
    req(input$age, message = "Age is required")
    validate(
      need(input$age >= 18, "You must be 18 or older"),
      need(input$age <= 120, "Age must be 120 or less")
    )

    # Validate country selection
    req(input$country, message = "Please select a country")

    # If we get here, all validations passed
    list(
      email = input$email,
      age = input$age,
      country = input$country,
      timestamp = format(Sys.time(), "%Y-%m-%d %H:%M:%S")
    )
  })

  # Display validation result
  output$validation_result <- renderPrint({
    # Try to get form data, which will trigger validations
    tryCatch({
      data <- form_data()
      cat("✅ All validations passed!\n")
      cat("Form submitted successfully at", data$timestamp)
    }, error = function(e) {
      # If validation failed, show the error message
      cat("❌ Validation failed:\n")
      cat(e$message)
    })
  })

  # Show submitted data (only if validation passes)
  output$submitted_data <- renderTable({
    # req() will stop if form_data() isn't available
    req(form_data())

    # Convert list to data frame for display
    data <- form_data()
    data.frame(
      Field = c("Email", "Age", "Country", "Submission Time"),
      Value = c(data$email, data$age, data$country, data$timestamp),
      stringsAsFactors = FALSE
    )
  })
}

shinyApp(ui, server)

5. Dependency Graph & Lazy Evaluation: The Reactive Engine
The dependency graph is Shiny's internal representation of how inputs, calculations, and outputs are connected. Lazy evaluation means computations only run when needed.
library(shiny)

ui <- fluidPage(
  titlePanel("Sum, Product & Plot Demo"),

  sidebarLayout(
    sidebarPanel(
      numericInput("x", "Enter x:",   value = 5),
      numericInput("y", "Enter y:",   value = 3),
      checkboxInput("show_sum",     "Show Sum",     value = TRUE),
      checkboxInput("show_product", "Show Product", value = TRUE),
      checkboxInput("show_plot",    "Show Plot",    value = TRUE),
      hr(),
      helpText("Toggle checkboxes to hide/show each output.")
    ),

    mainPanel(
      textOutput("sum_output"),
      textOutput("product_output"),
      plotOutput("plot_output", height = "300px")
    )
  )
)

server <- function(input, output, session) {

  # Render Sum
  output$sum_output <- renderText({
    if (!input$show_sum) return(NULL)
    paste0("Sum (x + y) = ", input$x + input$y)
  })

  # Render Product
  output$product_output <- renderText({
    if (!input$show_product) return(NULL)
    paste0("Product (x * y) = ", input$x * input$y)
  })

  # Render Plot
  output$plot_output <- renderPlot({
    if (!input$show_plot) return(NULL)

    sum_val     <- input$x + input$y
    product_val <- input$x * input$y

    par(mfrow = c(1, 2), mar = c(4, 4, 2, 1))

    # Barplot of Sum vs Product
    barplot(
      c(sum_val, product_val),
      names.arg = c("Sum", "Product"),
      col       = c("steelblue", "tomato"),
      main      = "Sum vs Product"
    )

    # Line plot with slope = sum/10
    plot(
      1:10, (1:10) * sum_val / 10,
      type = "b", pch = 19, col = "forestgreen",
      xlab = "X", ylab = "Y",
      main = paste("Line with slope =", round(sum_val/10, 2))
    )
    abline(a = 0, b = sum_val/10, col = "red", lty = 2)
  })
}

shinyApp(ui, server)

**Resource download links**
3.1.6.-R-Shiny-Reactive-Programming.zip